Mirro offers you multiple options to extract different information from the application, according to your needs. As an admin user, it's best to have an overview of the salary trends of your people.
To do so, you will need to access the Dashboard module where you will have access to the Salaries Insights section.
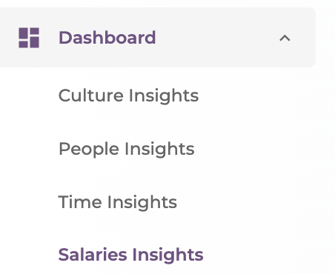
In this section, Mirro presents the aggregated financial data based on the information stored in the active contracts of the current month. To have a clear picture of the financial data, you will need to define the contracts for each user in part. You can define the contracts manually in Mirro or use the import option. To see how you can import these details, you can always check the article How to import contract details.
Once the contracts are defined, please make sure that you are granting the users the proper access rights using one of the options below:
- Employee contracts management - with this access right, the user will be able to define and manage employee contracts and see all the information stored in the salaries insights dashboard;
- Salaries insights access - with this access right, the user will have the possibility to visualize all information stored in the dashboard for each person in the company;
- Salaries insights departments access - an access right offering you the possibility to specify which head of department should have access to the financial data. If you offer this right to a user who is the head of a specific department, the user will be able to access the information of that specific department and the sub-departments;
To see how an access right can be granted to a user, please check the article How to assign a new role to a user.
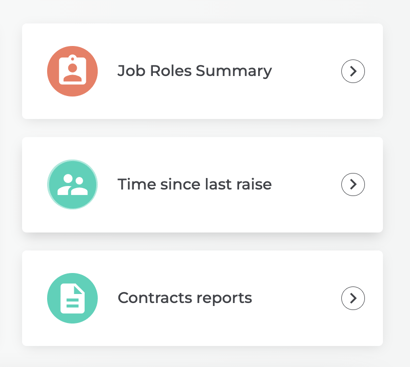
By accessing the Salaries Insights Dashboard, you will be able to visualize the following sections:
- Time since the last raise, helping you be fair to all people and providing immediate awareness of raise history and amount;
- Job Roles Summary helps you understand salaries breakdown per each job role and you can align your company as you see fit;
- Contracts reports, offering you an overview of all contracts available, you can use a similar template to import contracts for all people;
Each section in part will offer you the possibility to export all the information, while the sections Time since last raise and Positions summary will also give you the possibility to check all details visually using the existing graphic.
When accessing the Time since last raise section, you will be redirected to a new page where you will be able to visualize graphically the evolution of the salary increases within your company. For more details, you can consult the table below the graph which can be exported as a report.
To understand better the data presented, a scatter graph will be available to consult where:
- The X axis will represent the period measured in months. This is the period since the last salary raise took place;
- The Y axis represents the percentile where the raise is situated. The percentile indicates how many of the individuals in a specific range (e.g. job roles or departments) fall under a specific value;
All values are shown in the default currency of your company. If any contract has a different currency than the default one, a conversion will be made automatically to the default. An average exchange rate from the previous month will be used for the conversion.