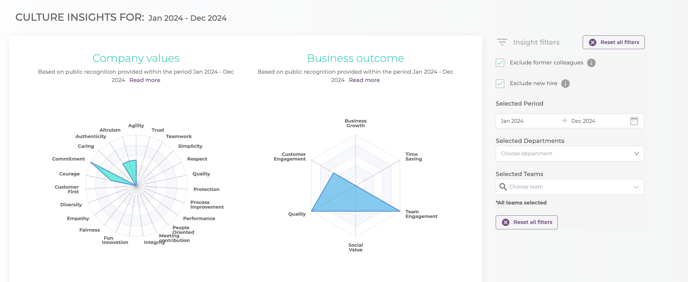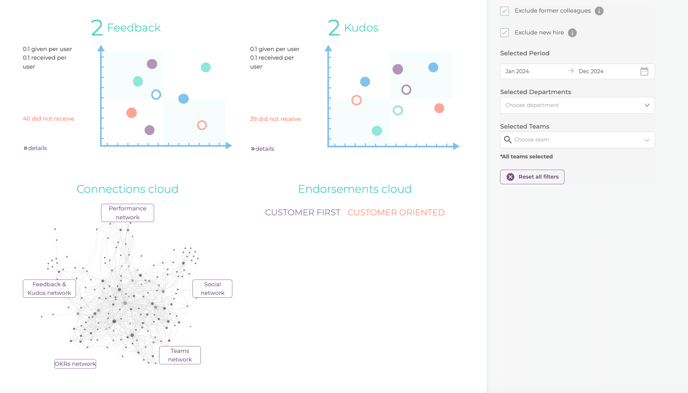
Accessing the Culture Insights section, you will be able to filter the information and have an overview at the level of the company or per each department in part, showing you the following details:
1. Filters to filter your data by different criteria;
2. Insights for the following options:
-feedback;
-kudos;
3. Company values: based on public recognition provided within the selected period;
4. Business outcome: based on public recognition provided within the selected period;
5. Connections cloud;
6. Endorsements cloud;


Company values
Company values are behaviors captured in public praise (kudos) that embody company values. A value having a lower number of kudos does not imply that it is not lived by the team, but it might signal that the team doesn’t always recognize behaviors showing that value.
Help your team understand what the company values mean and how to recognize specific behaviors. You could try making the values clearer and easier to understand by:
- adding short descriptive sentences;
- making sure they capture the company beliefs & principles that drive the business;
Business outcome
Public praise (kudos) shows how a specific behavior or action had an impact on business. A business outcome with a lower number of kudos does not imply that the outcome is not achieved by the team, but it might signal that the team doesn’t always recognize actions and behaviors that lead to that specific business outcome.
Help your team understand what each business outcome means and how to recognize specific behaviors. You could try making the business outcomes clearer and easier to understand by adding short descriptive sentences and providing examples.
Feedback
On this page you can find the total number of feedbacks given and received for a certain period of time, and you can also export a detailed report, with the following information:
-the name of the users;
-the number of feedbacks given by this user;
-the number of feedbacks received by this user;
-ratio given;
-grid category;
You will be able to see the users colored based on their access rights, more exactly:
-blue for basic users;
-purple for team leaders;
-green for performance managers;
-orange for head of departments;
Also, on the same page, you can see the users who are mostly receivers (and encourage them to engage with their colleagues), the givers (you can empower their colleagues to engage with them), the drivers (you can recognize their commitment) and the ones with the low engagement (and you can ask them to engage more).
The top feedback drivers and the users with no feedback will be shown here, to let you know whom you should congratulate and whom you should offer feedback, to make the other colleagues more engaged.
Kudos
The same as for the Feedback section, on this page you can find the total number of kudos given and received for a certain period of time, and you can also export a detailed report, with the following information:
-the name of the users;
-the number of kudos given by this user;
-the number of kudos received by this user;
-ratio given;
-grid category;
You will be able to see the users colored based on their access rights, more exactly:
-blue for basic users;
-purple for team leaders;
-green for performance managers;
-orange for head of departments;
Also, on the same page, you can see the users who are mostly receivers (and encourage them to engage with their colleagues), the givers (you can empower their colleagues to engage with them), the drivers (you can recognize their commitment) and the ones with the low engagement (and you can ask them to engage more).
The top kudos drivers and the users with no kudos will be shown here, to let you know whom you should congratulate and whom you should offer kudos, to make the other colleagues more engaged.
Connections cloud
Each user represents a node. The node’s dimension is relative to the in/out links, and they are connected to each other.
The graphic you will see represents multiple types of networks, all connected to each other:
-Performance network;
-Social network;
-Teams network;
-OKRs network;
-Feedback and kudos network;
Performance network:
This network shows the relationships between performance managers and their teams between the selected period
On the bottom of the page you will also be able to see a list with all the performance managers with most interactions with their team members, and a list with all the people with no interactions with their performance managers. That way, you are able to identify the mentee- performance managers relationships that needs a little bit more interaction.
Social network
This network shows the social interactions within Mirro between the selected period. Interactions in Mirro (e.g. Kudos, Feedback, comments) will create links between people and give you a view of actual connections and their dynamics, and that is exactly what you are going to see.
You can use the filters from the right of the page to search for a certain period of time, certain users or any data that helps you.
Teams network
This network shows the teams and how people are part of one or more teams during the selected period.
You are also able to see the users that are part of many teams, and the users that have no team. Make them feel included and invite them to join a team!
OKRs network
This network shows the connections between people based on their shared OKRs during the selected period. Two people are connected if they share an active OKR during selected period, meaning they are either owners or contributors for those OKRs
You can use the filters from the right of the page to search for a certain period of time, certain users or any data that helps you.
You will also be able to visualize the people with the most OKRs (owners or contributors), and the people with no OKRs. That way, you can include everybody in the planning that will make your business grow!
Feedback and kudos network
This network shows the connections between people based on their shared feedback and praise between the selected period. The link between two people depends on the number of feedback and praise they gave each other.
You can use the filters from the right of the page to search for a certain period of time, certain users or any data that helps you.
On the same page you will be able to visualize the top 20 feedback and kudos providers and the top 20 feedback and kudos drivers for the selected period.
Endorsements cloud
This cloud represents all the tags included in the received kudos for the selected period.

